North West Hotspots for Noise Nuisance Complaints [Infographic]
Cirrus Research has been involved in an interesting project that looks at noise nuisance across the North West. Some of you might remember that we did a similar exercise last year for Yorkshire; this time around we went across the Pennines to see what kind of data we could retrieve from the Local Authorities there.
Overall, we found there were 39,960 noise nuisance complaints across the region in 2015. This is largely comparable to Yorkshire but with a much broader spread of the complaints. The vast majority of the district came within a fairly narrow numbers band, whereas in Yorkshire we saw some significant spikes in complaints (Doncaster and Rotherham in particular).
We gathered our data via a series of Freedom of Information requests from local authorities. It sounds simple enough but the whole process took weeks to complete due to the different LAs’ interpretation of the FOI rules. However, we came away with only one area unable to supply the figures and so were able to compile an accurate noise nuisance map for the region.
North West Noise Nuisance Complaints Map [Infographic]
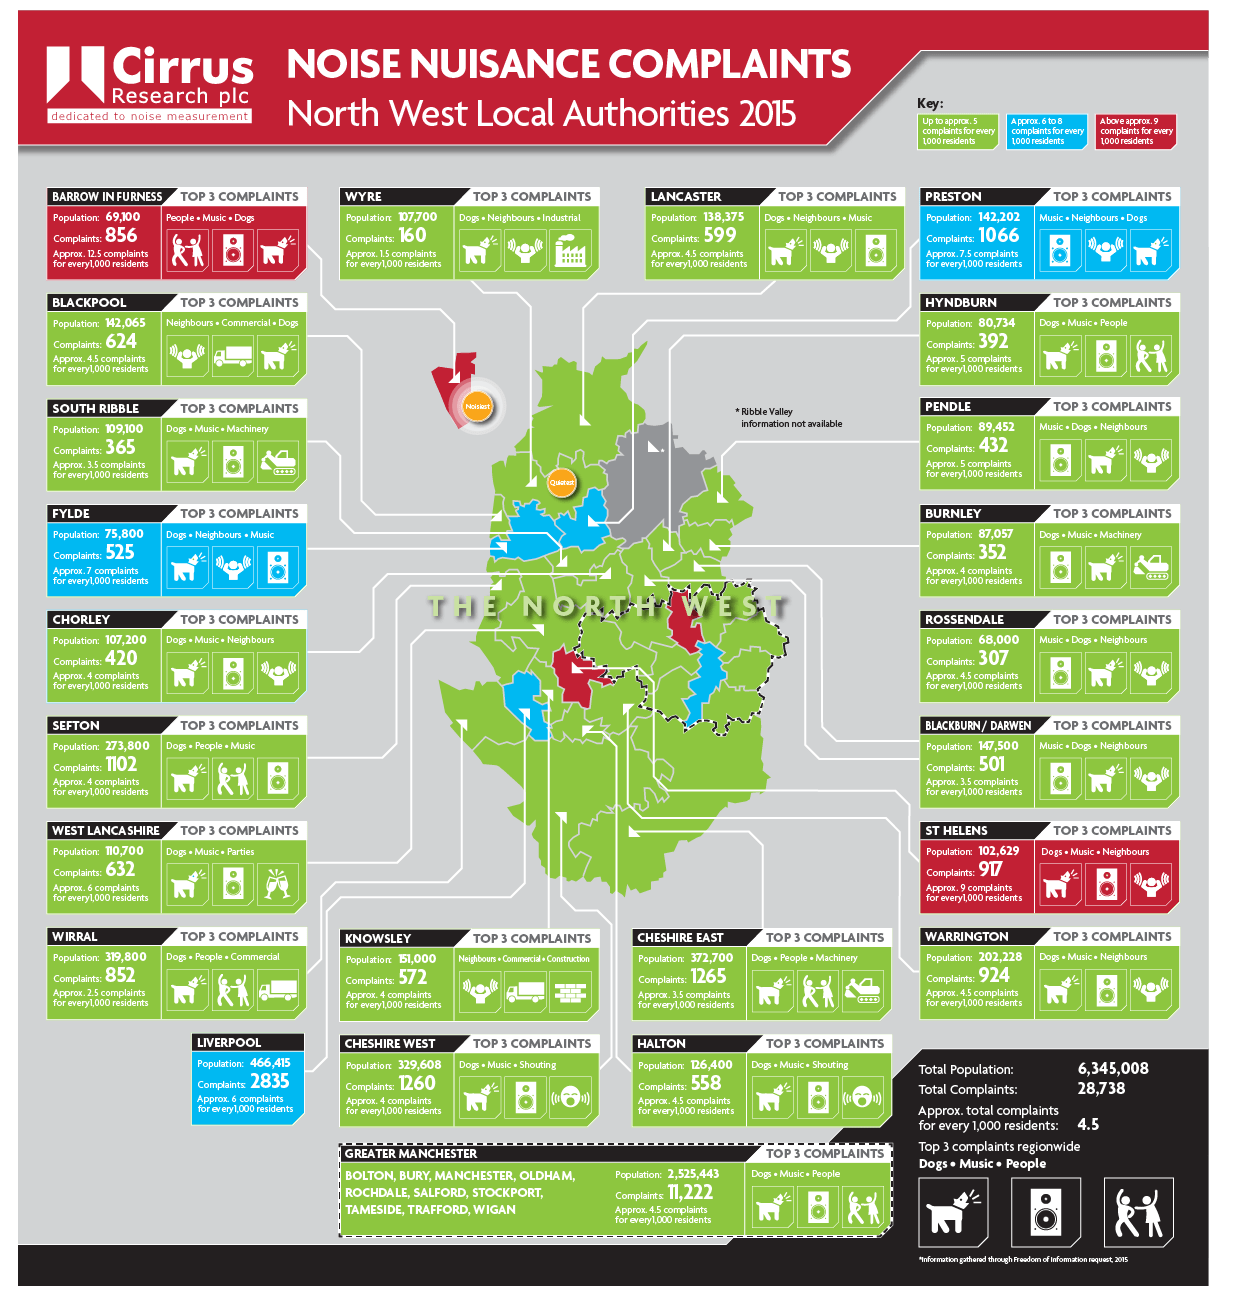
- LOUDEST: Barrow-in-Furness top of the noisy neighbour poll with 856 complaints over the 12 months covering a population of 69,100 – the equivalent of approximately 12.5 complaints per 1,000 head
- St Helens came second with 917 complaints within a population of 202,200 – the equivalent of 9 complaints per 1,000
- Preston came third with 1,066 complaints within a population of 142,200, or 7.5 complaints per 1,000
- QUIETEST: The quietest was sleepy Wyre with just 160 complaints across the year in a population of 107,000, or 1.5 per 1,000 residents
We should also explain at this stage that we conducted our research based on complaints per 1,000 population to get a more accurate picture. So, whilst on paper St Helens received more complaints than Barrow-in-Furness, it has a much larger and denser population so that has to be taken into account to get a true picture.
The vast majority of issues logged related to noisy neighbours, shouting or playing loud music in the home, followed by barking dogs and then errant car or home alarms being triggered.
Greater Manchester Noise Nuisance Complaints Map [Infographic]
Of the total number of complaints for the whole of the North West (39,960), Greater Manchester local authorities accounted jointly for 11,222 of those, or 28% of the total. No real surprise there with the large urban conurbations within and around the city. Here’s the map for Greater Manchester in more detail.
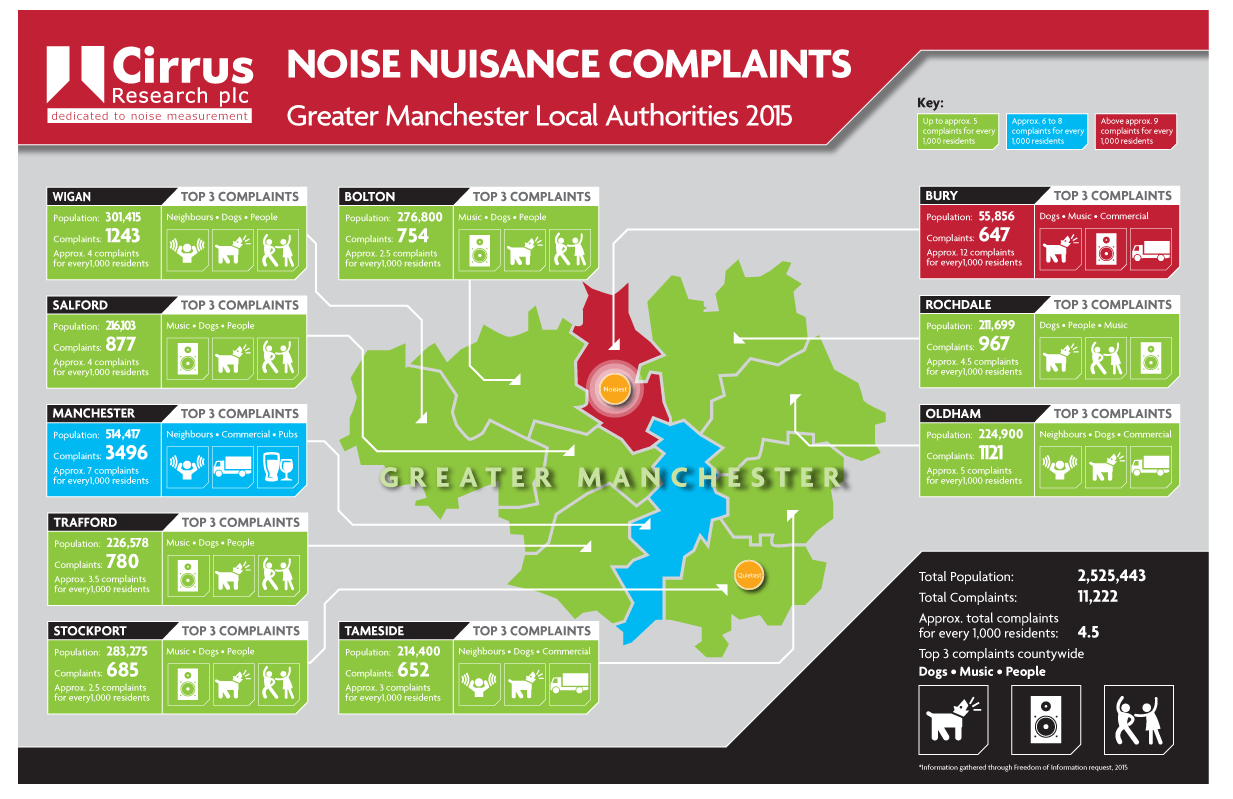
- LOUDEST: Bury top of the noisy neighbour poll with 647 complaints over the 12 months covering a population of 55,800 – the equivalent of approximately 12 complaints per 1,000 head
- Manchester Borough came second with 3,496 complaints within a population of 514,400 – the equivalent of 7 complaints per 1,000
- Oldham came third with 1,121 complaints within a population of 224,900 – or 4.5 complaints per 1,000
- QUIETEST: The quietest was Stockport with 685 complaints across the year in a population of 283,275 or 2.5 complaints per 1,000 residents
The vast majority of issues logged related to noisy neighbours, shouting or playing loud music in the home, followed by barking dogs and then errant car or home alarms being triggered. Manchester Borough had complaints about noise from clubs and bars amongst its top three
Noise Nuisance Complaints Leading to Convictions
We also asked how many of those complaints ended up being prosecuted or convicted – with only 7 cases ending up in court across the whole of the North West region. The vast majority were resolved using mediation or warnings.
Resolving Noise Nuisance Complaints
It seems that certain trends are emerging. People are now much more aware of their rights and more likely to complain rather than grin and bear it. Elderly people are more likely to complain as they spend more time indoors. Also, with more homes now having wooden or laminate floors, as well as wall-mounted TVs, we are seeing more domestic complaints as there is less to insulate the noise within the home.
We work with many local authorities and housing associations. We know what a difficult job they face in terms of investigating and gathering any evidence. What one person thinks is acceptable could drive someone else crazy, so noise enforcement teams have fine line to tread.
We have spoken to numerous noise enforcement officers over recent months who currently use our TrojanLITE and Trojan2 Noise Nuisance Recorders as part of their everyday technology arsenal for monitoring noise nuisance. With their help, we have compiled this 6 step guide to help local authorities to resolve noise nuisance complaints.

Jaymee-lee Tolliday
Latest posts by Jaymee-lee Tolliday (see all)
- Turning Down the Volume: How the Trojan Noise Nuisance Recorder can help create a quieter world - 13th February 2024
- Festive Opening Hours 2023 - 6th December 2023
- Award of Excellence for Cloud-Based Monitoring Solutions 2023! - 20th November 2023